Assessing NVIDIA's Performance Against Competitors In Semiconductors & Semiconductor Equipment Industry
Benzinga
By Benzinga Insights
In the dynamic and fiercely competitive business environment, conducting a thorough analysis of companies is crucial for investors and industry enthusiasts. In this article, we will perform an extensive industry comparison, evaluating NVIDIA (NASDAQ:NVDA) in relation to its major competitors…
In the dynamic and fiercely competitive business environment, conducting a thorough analysis of companies is crucial for investors and industry enthusiasts. In this article, we will perform an extensive industry comparison, evaluating NVIDIA (NASDAQ:NVDA) in relation to its major competitors in the Semiconductors & Semiconductor Equipment industry. By closely examining crucial financial metrics, market position, and growth prospects, we aim to offer valuable insights for investors and shed light on company's performance within the industry.
NVIDIA Background
Nvidia is a leading developer of graphics processing units. Traditionally, GPUs were used to enhance the experience on computing platforms, most notably in gaming applications on PCs. GPU use cases have since emerged as important semiconductors used in artificial intelligence to run large language models. Nvidia not only offers AI GPUs, but also a software platform, Cuda, used for AI model development and training. Nvidia is also expanding its data center networking solutions, helping to tie GPUs together to handle complex workloads.
Company P/E P/B P/S ROE EBITDA (in billions) Gross Profit (in billions) Revenue Growth NVIDIA Corp 53.88 45.98 28.22 28.72% $31.94 $33.85 55.6% Broadcom Inc 88.59 22.27 27.89 5.8% $8.29 $10.7 22.03% Taiwan Semiconductor Manufacturing Co Ltd 33.38 10.53 14.18 8.71% $684.78 $547.37 38.65% Advanced Micro Devices Inc 141.05 6.41 12.99 1.48% $0.72 $3.06 31.71% Micron Technology Inc 25.89 4.07 5.92 6.1% $5.9 $5.05 46.0% Qualcomm Inc 16.19 6.65 4.33 9.71% $3.52 $5.76 10.35% ARM Holdings PLC 241.43 24.09 41.15 1.88% $0.17 $1.02 12.14% Texas Instruments Inc 33.20 10.07 9.99 7.85% $2.09 $2.58 16.38% Analog Devices Inc 60.54 3.43 11.41 1.5% $1.33 $1.79 24.57% NXP Semiconductors NV 26.89 5.94 4.76 4.71% $0.92 $1.56 -6.43% Monolithic Power Systems Inc 25.66 13.81 18.65 4.01% $0.18 $0.37 30.97% ASE Technology Holding Co Ltd 24.08 2.68 1.28 2.49% $26.99 $25.69 7.5% STMicroelectronics NV 61.51 1.38 2.28 -0.05% $0.62 $0.65 -14.42% Credo Technology Group Holding Ltd 206.76 32.96 46.14 8.67% $0.07 $0.15 273.57% First Solar Inc 19.78 2.90 5.73 4.09% $0.49 $0.5 8.58% ON Semiconductor Corp 48.46 2.62 3.37 2.13% $0.38 $0.55 -15.36% United Microelectronics Corp 13.81 1.72 2.40 2.45% $24.98 $16.88 3.45% Skyworks Solutions Inc 30.32 2 3 1.81% $0.23 $0.4 6.57% Rambus Inc 47.12 8.71 16.72 4.85% $0.08 $0.14 30.33% Lattice Semiconductor Corp 320.30 14.68 20.79 0.42% $0.02 $0.08 -0.08% Average 77.1 9.31 13.31 4.14% $40.09 $32.86 27.71%When analyzing NVIDIA, the following trends become evident:
-
With a Price to Earnings ratio of 53.88, which is 0.7x less than the industry average, the stock shows potential for growth at a reasonable price, making it an interesting consideration for market participants.
-
The elevated Price to Book ratio of 45.98 relative to the industry average by 4.94x suggests company might be overvalued based on its book value.
-
With a relatively high Price to Sales ratio of 28.22, which is 2.12x the industry average, the stock might be considered overvalued based on sales performance.
-
With a Return on Equity (ROE) of 28.72% that is 24.58% above the industry average, it appears that the company exhibits efficient use of equity to generate profits.
-
With lower Earnings Before Interest, Taxes, Depreciation, and Amortization (EBITDA) of $31.94 Billion, which is 0.8x below the industry average, the company may face lower profitability or financial challenges.
-
The gross profit of $33.85 Billion is 1.03x above that of its industry, highlighting stronger profitability and higher earnings from its core operations.
-
The company's revenue growth of 55.6% exceeds the industry average of 27.71%, indicating strong sales performance and market outperformance.
Debt To Equity Ratio
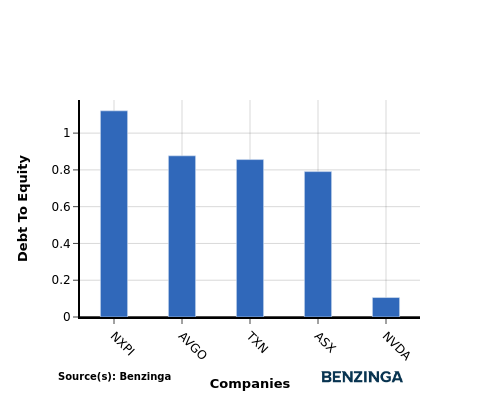
The debt-to-equity (D/E) ratio is a measure that indicates the level of debt a company has taken on relative to the value of its assets net of liabilities.
Considering the debt-to-equity ratio in industry comparisons allows for a concise evaluation of a company's financial health and risk profile, aiding in informed decision-making.
By evaluating NVIDIA against its top 4 peers in terms of the Debt-to-Equity ratio, the following observations arise:
-
NVIDIA exhibits a stronger financial position compared to its top 4 peers in the sector, as indicated by its lower debt-to-equity ratio of 0.11.
-
This suggests that the company has a more favorable balance between debt and equity, which can be seen as a positive aspect for investors.
Key Takeaways
For NVIDIA, the PE ratio is low compared to peers, indicating potential undervaluation. The high PB and PS ratios suggest strong market sentiment and revenue multiples. The high ROE reflects efficient use of shareholder equity, while the low EBITDA may indicate room for operational improvement. The high gross profit margin and revenue growth rate outperform industry peers, highlighting strong financial performance.
This article was generated by Benzinga's automated content engine and reviewed by an editor.
© 2025 Benzinga.com. Benzinga does not provide investment advice. All rights reserved.